New U.S. tariff policies: What’s at stake for sub-Saharan Africa?
Current U.S. trade policies—though primarily focused on major global players including China, the European Union, and North American partners Canada and Mexico—also have economic consequences for smaller countries and regions around the world. In sub-Saharan Africa (SSA), these impacts will be felt both directly, through newly imposed tariffs, and indirectly, as collateral damage in a potential trade war between the world’s largest economies.
As the United States rolls out a new wave of tariff increases, SSA countries must navigate a newly challenging trade environment. The region has long benefited from preferential access to U.S. markets—in particular, the 2000 African Growth and Opportunity Act (AGOA) has exempted 1,800 SSA products from import duties. Yet now, many African exports are subject to a flat 10% tariff, effectively eliminating one of the few trade advantages the region held for the U.S. market.
At a time when African food security, inflation, and economic resilience are already under immense pressure, the erosion of these trade preferences deepens SSA’s vulnerability and raises urgent questions about the continent’s place in an increasingly fragmented global trade system.
Yet initially at least, our modeling suggests that direct impacts of the new U.S. tariffs on SSA countries’ agrifood trade will likely be relatively small—reflecting the already limited trade between the two. Based on FAOSTAT data, SSA bilateral agricultural trade with the U.S. totaled $3.4 billion in 2023—only 3% of the continent’s overall agricultural trade.
Nonetheless, the tariffs could have potentially significant indirect impacts on agricultural trade flows between SSA countries and other countries and regions (e.g., the EU) with trade more significantly disrupted by the new tariffs. Particularly affected are export-sensitive crops including coffee and tea, fruits and vegetables, and processed foods.
SSA agricultural trade
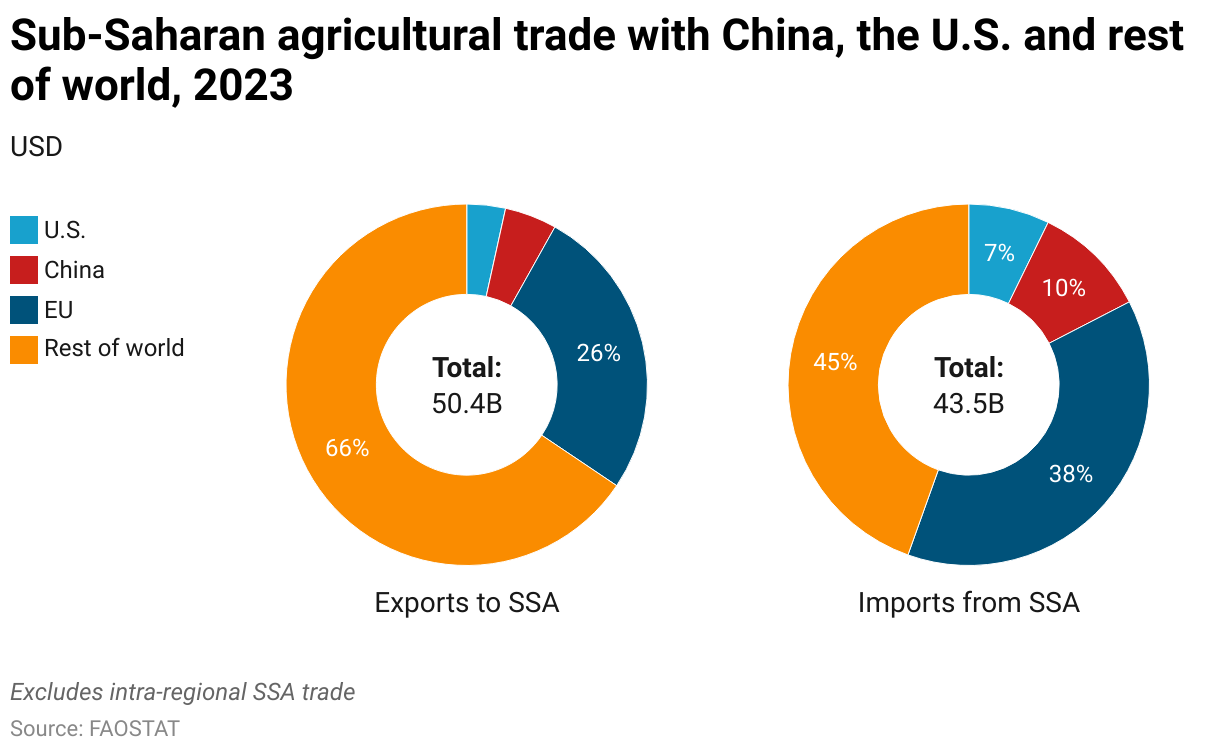
Based on data from FAOSTAT, agricultural exports to SSA (excluding intra-regional trade) totaled more than $50 billion in 2023 (Figure 1). Over the same period, agricultural imports from SSA countries (excluding intra-regional trade) totaled almost $44 billion. The EU remains the SSA’s largest trading partner, accounting for over 26% of agricultural exports to SSA countries and 38% of agricultural imports from SSA countries. By contrast, agricultural trade between SSA countries and China and the U.S. is more modest. Combined, China and the U.S. accounted for 8% of total agricultural exports to SSA and 17% of agricultural imports from SSA.
Figure 1
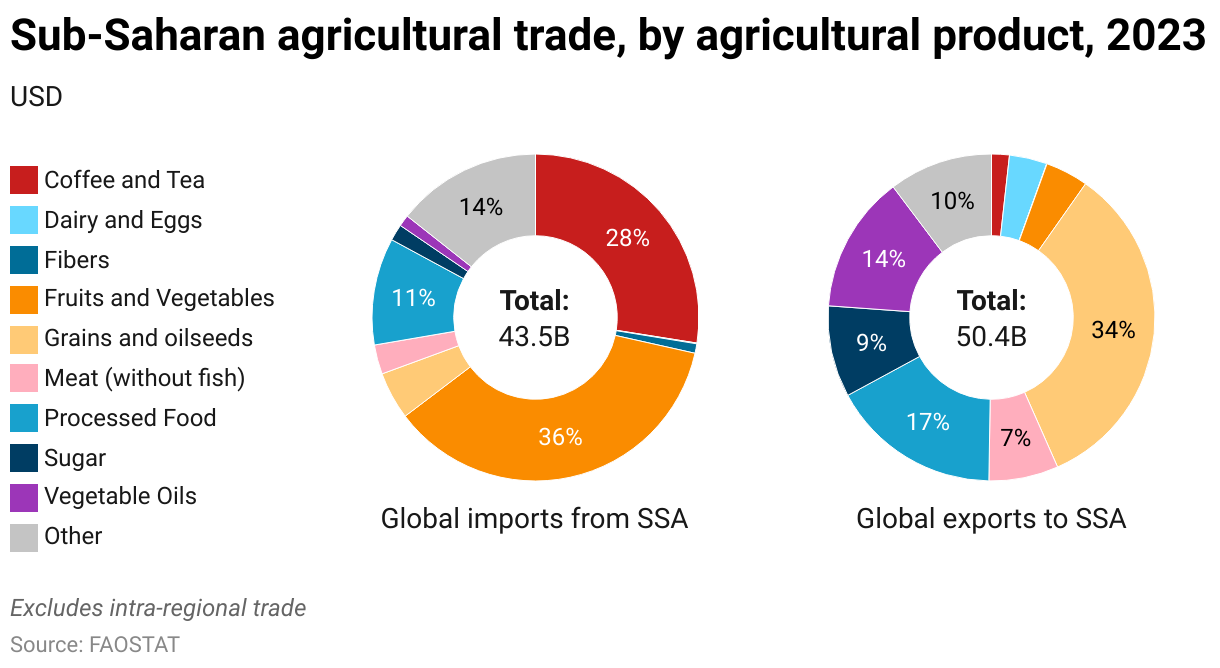
Global imports from SSA countries (excluding intra-SSA trade) are dominated by fruits and vegetables (36%), coffee and tea (28%), and processed foods (11%) (Figure 2). Global exports to SSA are led by grains and oilseeds (34%), processed foods (17%), and vegetable oils (14%).
Figure 2
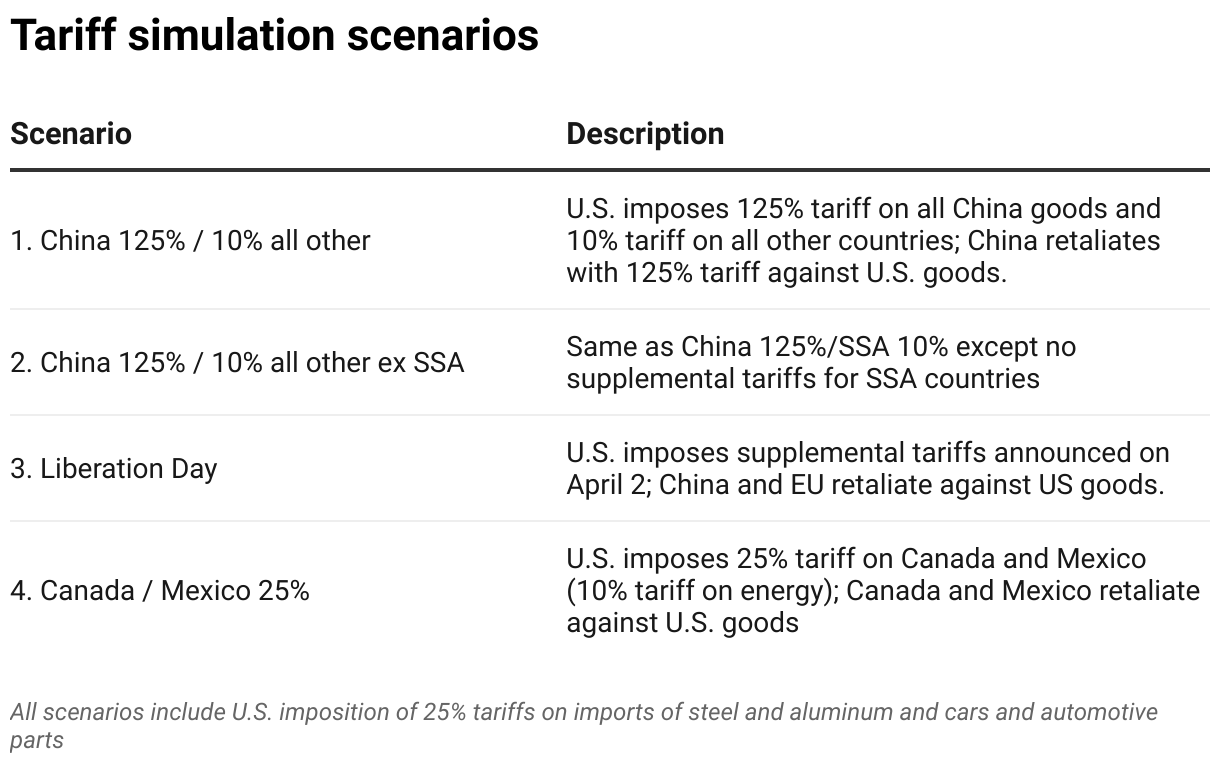
Using the MIRAGRODEP model, we analyze four tariff scenarios (Table 1). The first scenario reflects the full implementation of the U.S. tariff scheme announced as of April 12 (and as discussed in our previous blog post of April 21) which includes a 125% supplemental tariff on China and the 10% supplemental tariff on imports from nearly all other trading partners. In response, China is assumed to counter-retaliate with a 125% supplemental tariff on U.S. exports. The second scenario mirrors these conditions but excludes African countries from the 10% universal tariff, allowing us to assess the differential impacts of removing Africa from the broader tariff escalation and what it would mean to keep the AGOA in force. The third scenario considers the so-called Liberation Day tariffs announced by the U.S. on April 2 and discussed in more detail in our blog post of April 8. Lastly, we include a scenario where the U.S. imposes a 25% tariff on imports from Canada and Mexico (10% on energy imports) which prompts counter-retaliatory tariffs of equal magnitude from those countries on U.S. goods. This last scenario was discussed in more detail in our blog post of March 4.
Table 1
SSA exports
The model indicates that overall, U.S. tariffs result in marginally favorable outcomes for SSA agrifood exports. With direct access to the U.S. market becoming more costly and less competitive, exporters pivot toward alternative destinations—including SSA. Thus SSA agrifood exports are estimated to rise under all four scenarios; the increase is smallest under the first scenario (across-the-board 10% tariffs)—0.1% (Table 2).
Table 2
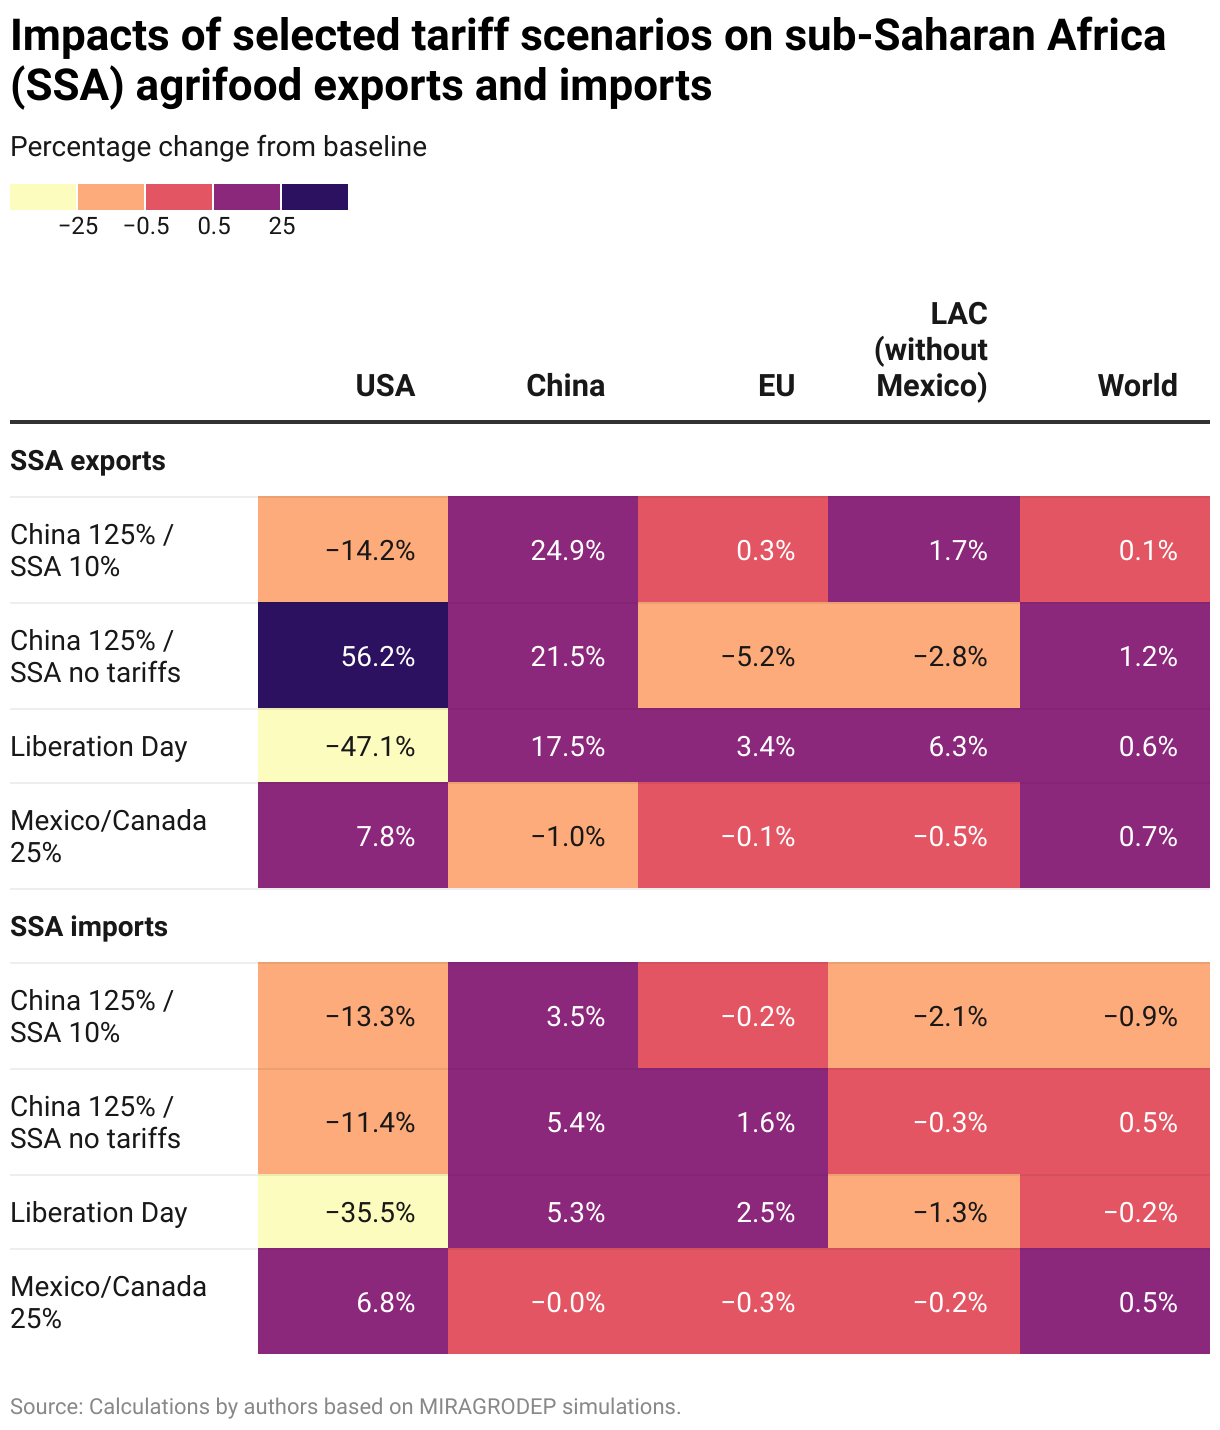
Export impacts in the other scenarios are also relatively small. Some SSA exports are diverted to other markets, particularly China (up 24.9%) which seeks alternative suppliers due to its trade war with the U.S.
In the absence of the 10% tariff (scenario 2), SSA agrifood exports rise by an estimated 1.2%—the largest increase under the four scenarios. With the 125% tariffs virtually halting bilateral trade between China and the U.S., and SSA exporters facing no additional U.S. duties, SSA agrifood exports to the U.S. increase (up 56%), as well as to China (up 21%). SSA exports to other markets such as the EU and Latin American and Caribbean (LAC) countries fall as exports are diverted to the U.S. and China.
The Liberation Day tariffs (scenario 3) cause large declines in SSA agrifood exports to the U.S., but those losses are offset by increased exports to other regions, particularly China and the EU. Some SSA countries that face very high tariffs (e.g., 47% for Madagascar, 50% for Lesotho) could see proportionally higher losses in the U.S. market.
In the North American trade war scenario (scenario 4), SSA exports to the U.S. increase as the U.S. sources more agrifood imports from the rest of the world to make up for reduced imports from Mexico and Canada. As some SSA exports shift to the U.S., exports to other regions fall (e.g., China, the EU, and LAC). But overall, SSA exports increase by 0.7% over baseline levels.
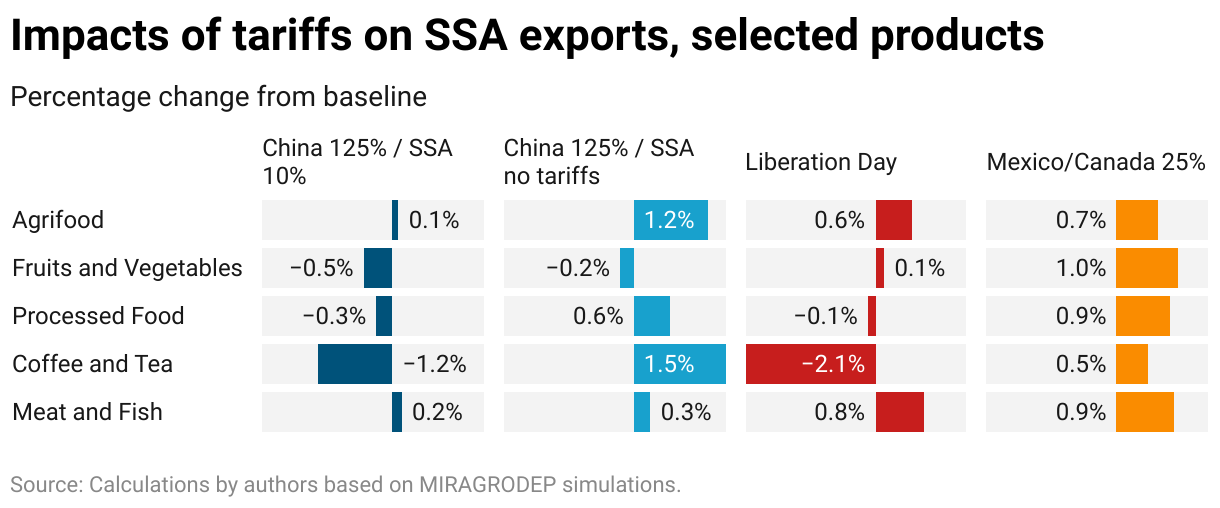
SSA product export impacts
Reflecting the overall model results, the impacts on SSA exports of individual products fall within a narrow range with small increases and decreases (Figure 3). Coffee and tea exports and processed products show small declines under scenarios 1 and 3 as U.S. imports fall due to the imposition of tariffs on SSA imports. Overall, export losses are offset by increases elsewhere, such as wool exports from southern Africa to China.
Figure 3
SSA imports
On the import side, the picture is more mixed: SSA agrifood imports from the U.S. decline under all scenarios except one (scenario 4, 25% tariffs on Canada and Mexico) due to terms of trade effects.
The imposition of U.S. tariffs causes the U.S. dollar to appreciate, making U.S. products less competitive in SSA markets. The decline in imports from the U.S. is largest under the Liberation Day tariff scenario—35.5%—due to a strong dollar and weakened U.S. economy. Under scenario 4, in contrast, SSA agrifood imports from the U.S. increase almost 7% as U.S. exports are diverted away from its North American partners due to their counter-retaliatory tariffs.
In scenarios 1, 2, and 3, high tariffs imposed by the U.S. against China result in increased China exports to SSA due to its loss of the U.S. market and lower value of its currency vs. the U.S. dollar. The impacts of U.S. tariffs on EU exports to SSA are mixed, with exports declining marginally under scenarios 1 and 4 and increasing under scenarios 2 and 3.
Tariffs and agrifood prices
Global agrifood prices decline under three of the four scenarios and rise slightly in the last (U.S.-Mexico-Canada trade conflict) (Figure 4).
Figure 4
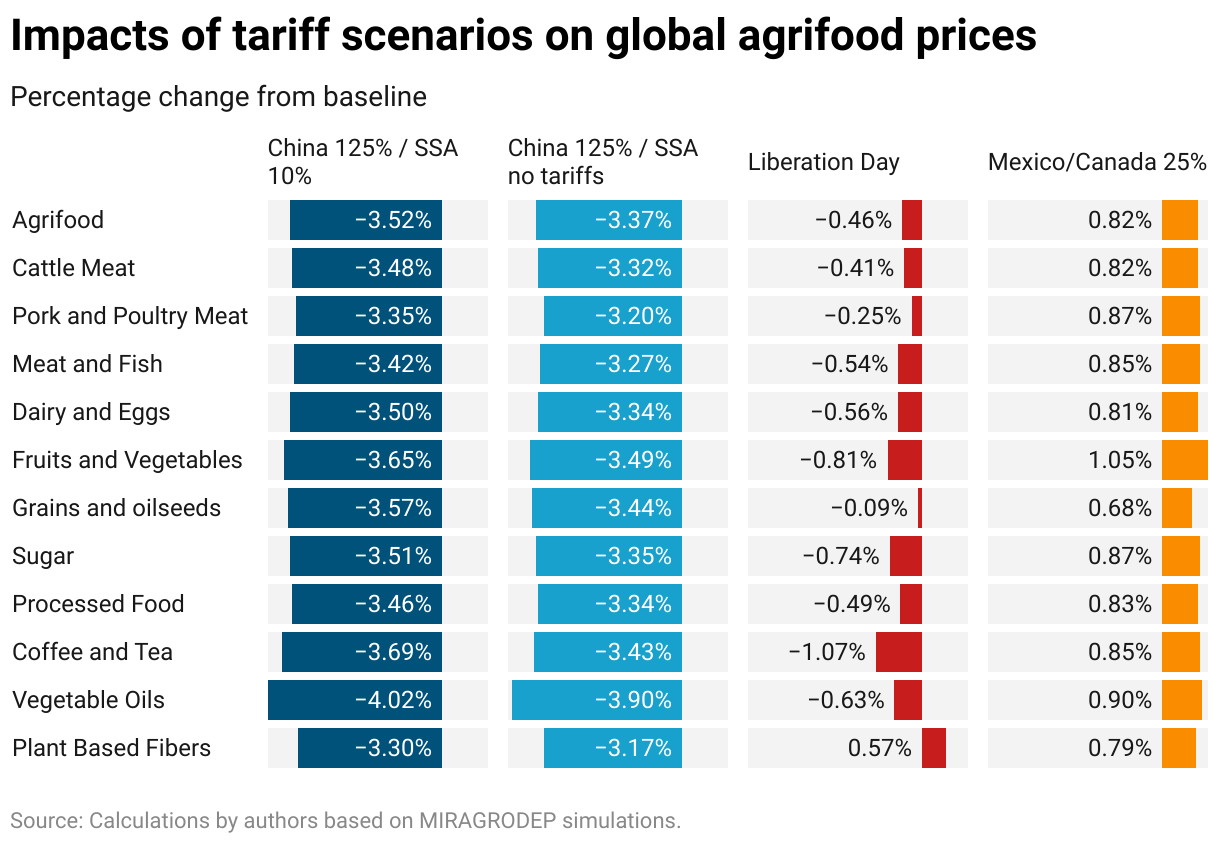
Prices decline the most under scenarios 1 and 2 (U.S. imposes 125% tariffs on China goods; China counter-retaliates with equivalent tariffs). Agrifood prices fall across all categories in both scenarios, but the decline is more pronounced in scenario 1, with SSA also targeted.
The Liberation Day tariffs (scenario 3) also result mostly in marginal price declines, again largely because of a high U.S. tariff imposed on China imports (54%, with counter-retaliation by China). Scenario 4 (25% tariffs on Canada and Mexico with counter-retaliation against the U.S.) results in small global increases, most just under 1%.
Lower prices for agrifood producers can mean lower profits depending on the impact of the tariffs on input prices and other factors. Producer losses are likely offset somewhat by gains to consumers who benefit from lower food prices.
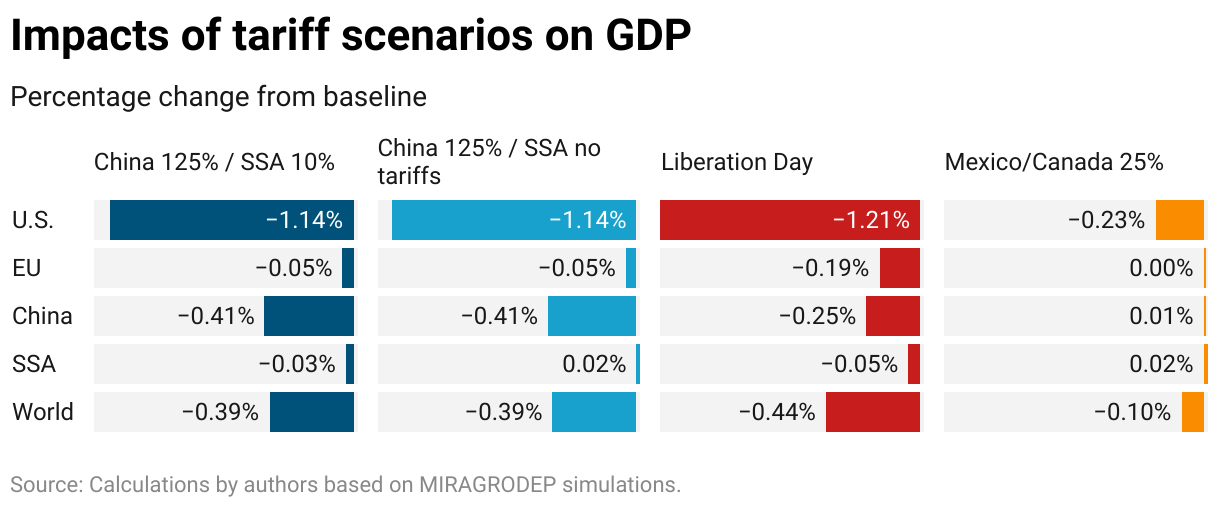
Impact of tariffs on SSA economic growth
While global GDP declines marginally across all tariff scenarios, SSA experiences only negligible economic growth impacts of less than 0.1% from baseline levels (Figure 5).
Global GDP falls the most in scenarios 1, 2, and 3 where the U.S. imposes large tariffs on China and China counter-retaliates (Figure 5). Percentage declines in U.S. GDP are more than double both global and China GDP losses. U,S. GDP falls the most (1.21%) under the Liberation Day scenario, though this figure is only slightly greater than those from a U.S.-China trade war (scenarios 1 and 2).
Figure 5
Conclusions
SSA is facing a climate of economic uncertainty exacerbated by trade disruptions and its existing vulnerabilities. The IMF now projects that SSA growth will slow to 3.8% in 2025, reflecting a 0.4 percentage point downgrade from its January 2025 forecast. In a press briefing at the recent International Monetary Fund-World Bank Spring Meetings, IMF African Department Director Abebe Aemro Selassie noted that beyond softer commodity prices and tighter financial markets, rising global trade tensions and weaker international demand are further clouding the region’s short-term economic prospects.
After enduring five years of consecutive crises, SSA countries were already navigating the difficult task of restoring stability and advancing long-term development goals under high public expectations. These efforts are now further strained by reduced access to external financing, higher global borrowing costs—and increased uncertainty over trade. In this environment, building resilience to future shocks will be critical, and careful, credible, and consistent policymaking will be essential to sustaining recovery.
Our model suggests that SSA could largely sidestep the negative impacts of current global trade disruptions, at least for a time. U.S. tariffs and counter-retaliatory actions by other countries would likely have small impacts on SSA and might even bring some positive trade opportunities for the continent’s exporting countries. Yet those impacts would be offset by the negative impacts if the U.S. were to maintain 10% tariffs on SSA exports to the U.S.
It is worth noting that the results presented here may underestimate the impacts of tariffs, at least in the short run. An extended trade war between the U.S. and China could result in significant contractions in China’s industrial sector, which in turn would reduce demand for raw materials and inputs imported from Africa. Oil, minerals, and metals represent a significant part of African exports to China; thus, a significant reduction in demand could have a far larger impact on GDP in SSA.
For SSA policymakers, the current context highlights the need for a more strategic and resilient trade approach. That includes pushing for a timely and improved renewal of AGOA (due to expire later this year), strengthening intra-African trade through the African Continental Free Trade Area (AfCFTA), and investing in competitiveness to make African exports more attractive in an increasingly complex global market.
Valeria Piñeiro is the Regional Representative for Latin America and the Caribbean (LAC) with IFPRI’s Markets, Trade, and Institutions (MTI) Unit; Juan Pablo Gianatiempo is an MTI Research Analyst; Fousseini Traoré is an MTI Senior Research Fellow; Joseph Glauber is a Research Fellow Emeritus with IFPRI’s Director General’s Office. Opinions are the authors’.
Acknowledgement: This work was carried out under the CGIAR Science Program on Policy Innovations and through support from the Famine Early Warning Systems Network (FEWSNET). We would like to thank all funders who supported this research through their contributions to the CGIAR Trust Fund (www.cgiar.org/funders)